We are living in a data-driven world and we expect our teams to embrace data and use it to its fullest, but there’s a dirty little secret holding us back from this goal: Most organizations don’t know where all their data is and how it connects.
If you are reading this, chances are you know some portion of your data landscape. You know some of the tools and platforms that the company uses and some of the places the data comes from. The team down the hall knows another set of data and sources. They probably know a few you don’t know about, and you probably know some that they don’t.
Even the most capable data and BI teams often don’t know where ALL the data is, because some of it sits as isolated islands in external third-party systems used by other stakeholder groups. These can be advertising and mar-tech platforms, or they may be SAAS platforms used for productivity or collaboration. They may even be manually managed spreadsheets sitting on one employee’s computer.
This fragmentation of knowledge creates a natural drag on the productivity and success of the company. In the absence of clear understanding, people make assumptions about what data is available and how it can be used. That leads to inefficiency when people do manual work that could be automated. It also limits creativity in identifying new opportunities.
Everyone’s an island
Here’s a simplified example (the dotted lines indicate what each team knows about):
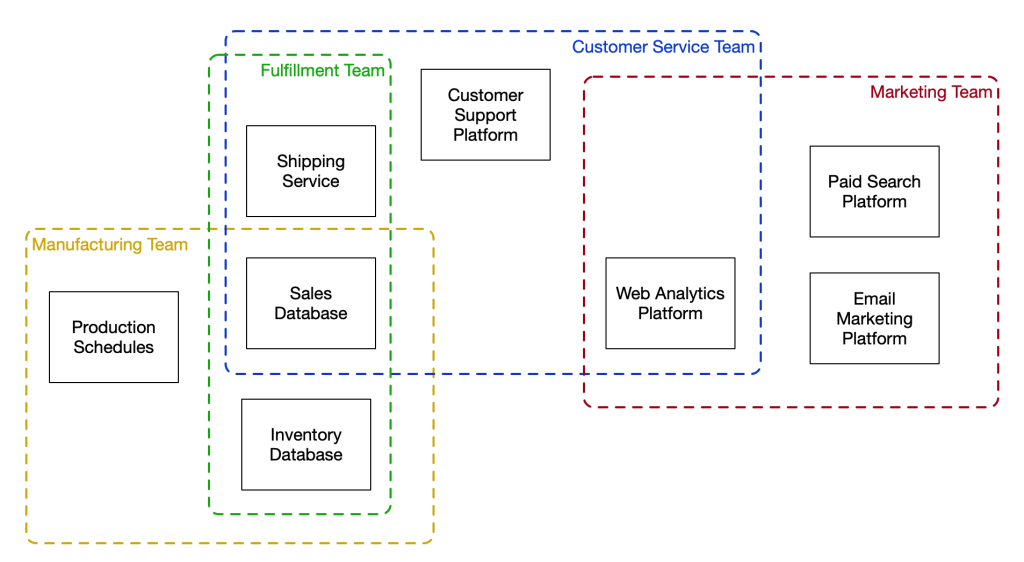
The Marketing team uses the web analytics data and the marketing platform data to try to optimize their marketing spend, leading them to focus heavily on product line A.
They don’t see the data from the purchasing and manufacturing departments that the cost of making product line A is rising faster than other product lines (thanks to the supply chain mess), driving down the profit margin of the line.
They also don’t see the fulfillment and customer service data, which shows that product line A has a higher return rate than product line B, further eating into the profitability of sales of product line A.
Meanwhile, the Manufacturing team interprets the strong sales numbers for product line A as an indication of market demand, rather than a reflection of the Marketing team’s priorities, so they allocate more resources to producing that line.
They also don’t know that a large number of people are searching on the company website for a product variation they don’t currently produce (i.e unmet demand and potential incremental sales).
Giving everyone a 30,000 foot view
The solution to this challenge is a process called Data Landscape Mapping. This is largely what it sounds like: visually mapping out the landscape of your data, identifying all of the systems that the data comes from and flows through. It also involves documenting as many details about the flow of data between systems as possible. The final outcome of this process is a set of documents that truly enlightens you, your team and your stakeholders.
How does a Data Landscape Map create value? There are three main ways this type of documentation can immediately create value for your organization:
- It identifies gaps in your data and the way it flows
- It inspires new opportunities to integrate and use your data
- It clears up misconceptions about the data
This documentation also dramatically improves onboarding of new talent, potentially cutting out months of confusion and misconceptions.
Glymr can bring Data Landscape Mapping into your company and help unlock the full value of your data. Contact us to start the conversation.